En-en adult card 12 carbon sinks
Card #12: Carbon Sinks
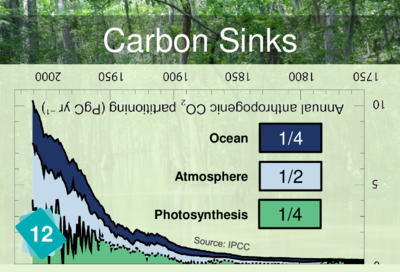
Half of the CO2 we emit every year is absorbed by carbon sinks:
- ¼ by vegetation via photosynthesis
- ¼ by the oceans
The remaining half stays in the atmosphere.
Explanation
The original IPCC graph represents both CO2 emissions and carbon sinks. The Climate Fresk has chosen to split it in two to show where CO2 comes from and where it goes. This is why the two cards are symmetrical: every year, the CO2 emitted by humankind has to go somewhere. Any CO2 that is not absorbed by the other carbon sinks remains in the atmosphere.
The text at the back of the card gives approximate absorption rates. The more detailed percentages are:
- 27.9% for the ocean
- 28.8% for photosynthesis[1].
Facilitation tips
This card is to be mirrored with the CO2 emissions card. To help the players figure this out, we can show them the card and ask "Can you see anything weird about this card?". Very often they notice that the legend is written upside-down. We can then tell them that it is a puzzle to be solved and that the answer is on the table. If the players do not figure it out, they can be given some clues:
- What is the type of representation? A graph
- What type of graph? A "filled" curve
- What is the legend? The same as for CO2 emissions.
Correction
Causes
Consequences
Other possible links
Other causes
- Deforestation Players often think that deforestation reduces carbon sinks. In reality, the impact is minimal because deforested areas represent a very small part of the total forest area. On the other hand, the CO2 emitted is very important.
- Agriculture It doesn't matter if this link is not made, but it is true that agriculture can improve storage capacity through photosynthesis. This is the 0.4% principle (if we increased the soil's capacity to sequester carbon by even 0.4%, we would have a significant impact on CO2).
Other consequences
- Decline in agricultural yields Studies have shown that yields increase with increased CO2, but that the nutrient content of vegetables is reduced as a result, because trace elements are not more abundant when yields increase.
Wrong links
Wrong consequences
- Energy budget The idea here is not to say there is no link between these two cards, but to make sure they are not mixed up. The carbon sinks card tells us where the carbon goes. The energy budget card tells us where the excess energy goes. Both distribute something, but not the same thing. To make it even more confusing, the atmosphere and the ocean are present in both.
To go further
Variation in photosynthesis
On this card, we can see that in some years photosynthesis drops to 0, and varies greatly from one year to another. The explanation comes from the fact that the residual carbon sink is calculated from the remaining value of the other variables[2]. This is why negative values are sometimes found. In this graph, emissions and their distribution only include flows that have varied since 1750, without the natural CO2 flows, such as CO2 degassing from lakes, rivers and oceans. However, the IPCC does not clearly explain why such a variation can be read on the graph.
It can be added that the atmospheric concentration has increased sharply in years with an El Niño phenomenon because it makes it difficult for vegetation to absorb carbon[3].
Carbon sinks capacity
Jean-Marc Jancovici’s web site - Won't "carbon sinks" absorb excess CO2? (French)
